
Benchmarking For Fertility: Three Reproductive KPIs Every Dairy Should Watch
During my twenty plus years of analyzing dairy reproductive records, my mantra has always been ‘benchmark against yourself, not your neighbor!’ Of course, there’s value in both, but my belief has always been that you’ll make the greatest gains by keeping your focus on your own results and figuring out how to improve them versus focusing on comparisons.
Having said that, there’s certainly perspective to be gained by stepping back from your daily view, ostrich-style, to see what is possible. And with the strong financial incentives for reproductive efficiency that exist today (high value calves and very expensive replacements), benchmarking outside of your close-knit circles can yield valuable insights. In this article, we’ll walk through the most important KPIs to track, whether internal or external benchmarking, and reveal how improving them can yield significant returns for your dairy.
Reproductive KPIs Every Dairy Should Watch
Measuring reproductive success isn’t just about confirming pregnancies – it’s about tracking the patterns that lead to long-term profitability. The right reproductive key performance indicators (KPIs) provide a clear picture of how well a herd is cycling, conceiving, and maintaining pregnancies. While there are many metrics to choose from, there are a few core metrics that rise to the top as the most meaningful and actionable.
- Percent Pregnant by 150 DIM. If I had to pick just one metric to use in benchmarking reproductive performance across herds, this is it. Simply, how well is a herd doing at getting cows pregnant in a profitable window after calving? The appeal of this simple metric for comparing across herds is that it does not care what your voluntary wait period is, and it fully accounts for the impact that lost pregnancies are having on your herd…two factors that can inadvertently skew the other leading metric: 21-day pregnancy rate.
Achievable benchmark goals for percent pregnant by 150 DIM is 75 to 85%. When these targets are not met, it often signals deeper issues – whether with heat detection, conception rates or early embryonic loss. Cows open beyond 150 DIM are at much greater risk for being culled from the herd and contribute less to overall herd efficiency.
- Pregnancy Rate. Closely tied to our first metric is pregnancy rate, which combines heat detection and conception rate into one number that tells us how many eligible cows became pregnant every 21 days. Herds with good pregnancy rates are hitting upper 20’s to low 30’s, while great preg rates are 35 to 45%.
While pregnancy rate is widely accepted as the primary reproductive metric to watch, it is not without blind spots. First, since pregnancy rate is most often calculated by adjusting to the actual voluntary wait period (VWP), herds that push their VWP out to 80-plus days without having stellar conception rates can find themselves with fewer cows pregnant by 150 days in milk. Secondly, preg rate does not fully account for the pregnancy losses that a herd experiences due to the lag in those lost pregnancies being identified. Depending upon your schedule for pregnancy reconfirmation, you may have to wait 6-8 months to have a more accurate view of your abortion percentage. You can do this by changing the dates on your pregnancy rate report to a more retrospective timeframe, excluding the most recent 6-8 months.
- Early Pregnancy Loss/Abort Rate. Finally, no discussion of reproductive KPIs is complete without addressing abort rate, or early pregnancy loss. Often overlooked, this metric tracks how many pregnancies are lost after initial pregnancy confirmation. A target of 5-8% is ideal, although many herds find themselves in the teens and even in their twenties on abort rate. One thing is sure…higher than ideal pregnancy losses are expensive, and can point to issues like heat stress, uterine health problems, or systemic inflammation that can otherwise go unnoticed.
Understanding the Numbers
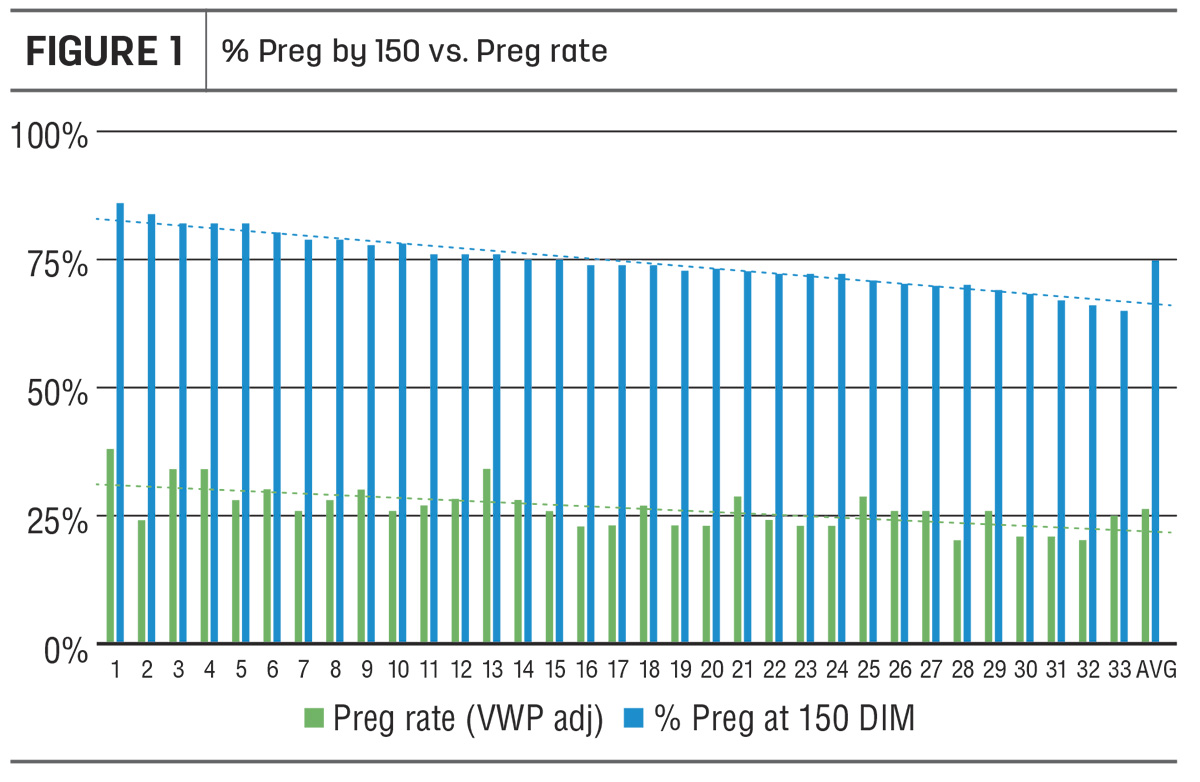
Let’s circle back to the pitfalls of only focusing on pregnancy rate by looking through a series of snapshots from my 2024 reproductive benchmarking project. We’ll use the results as illustrations on how these metrics relate (or not) to each other. Note that all these graphs have herds numbered from 1 to 35, by % Pregnant by 150 DIM, with #1 having the highest result.
First, look at Figure 1: % Preg by 150 vs. Preg Rate. What stands out to you about these trend lines? Did you notice how misaligned the Preg Rate trend is vs. % Preg by 150? They do not tell the same story! You’ll see some herds with high pregnancy rates, but their % Pregnant by 150 is in the low 70’s. And the opposite is true as well…a few herds with average preg rates are achieving a very high % pregnant by 150 DIM. Why would this be? Let’s keep going…
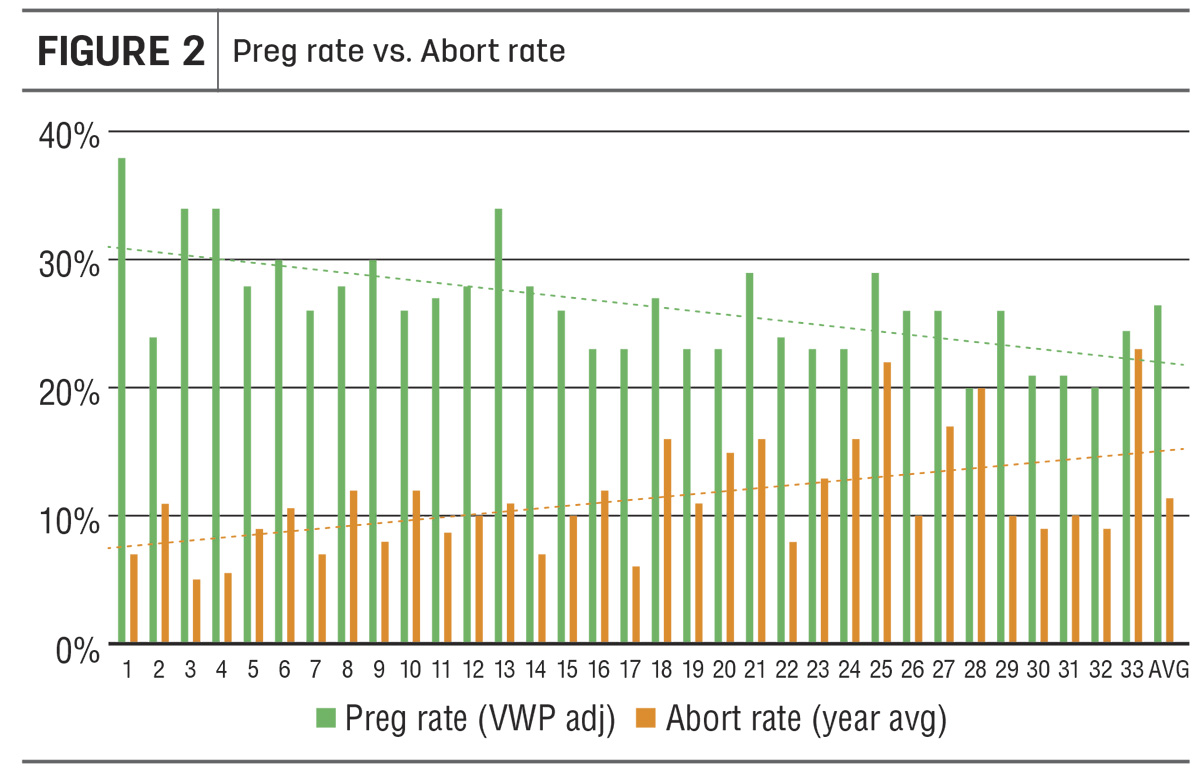
Next, let’s look at Figure 2: Preg Rate vs. Abort Rate. These herds are still in the same order…from highest to lowest on % pregnant by 150 DIM. Notice how tightly correlated the abort rate is to getting cows pregnant by 150 DIM. No doubt, it is hard to have a high % pregnant by 150 DIM with high pregnancy loss…the two do not compute. However, it is possible to have a high pregnancy rate and have a high abort rate. Hmm…can you see how that could be a problem if you only looked at preg rate to measure your success?
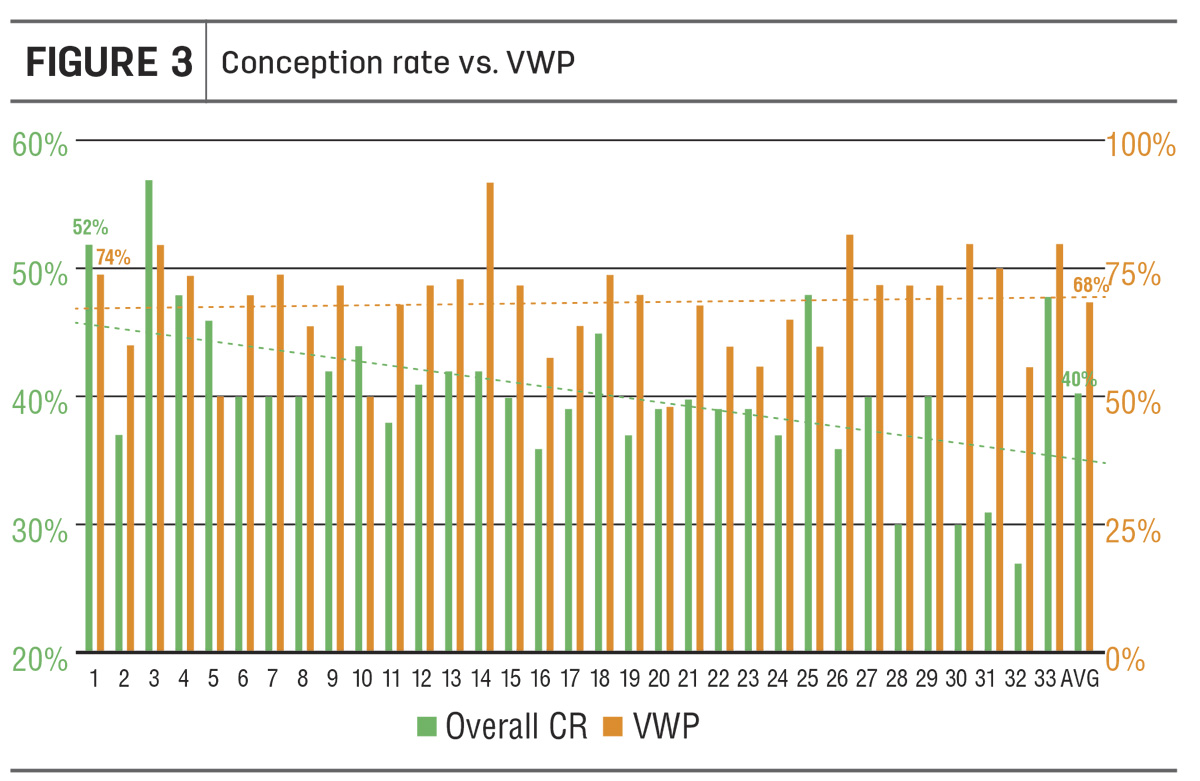
Now, let’s look at Figure 3: Conception Rate vs. VWP to see what, if any, insights we can gather from these metrics. Conception rate correlates quite well with % pregnant by 150 DIM…as it should. However, there’s zero correlation in this little dataset between VWP and how quickly cows are getting pregnant. That’s not to say that VWP doesn’t matter, or that it can’t be modified to improve conception results on an individual herd. However, what it does tell us is that it’s not the main driver of successful conception. Pushing your VWP out to 80 plus days without already having excellent conception rates is a recipe for more cows with extended lactations. On the other hand, there are some of the highest herds that have relatively low VWPs…they are starting a bit earlier and using some combination of visual heat detection, sync programs, or pedometers. My conclusion: there’s more than one way to create a successful breeding program.
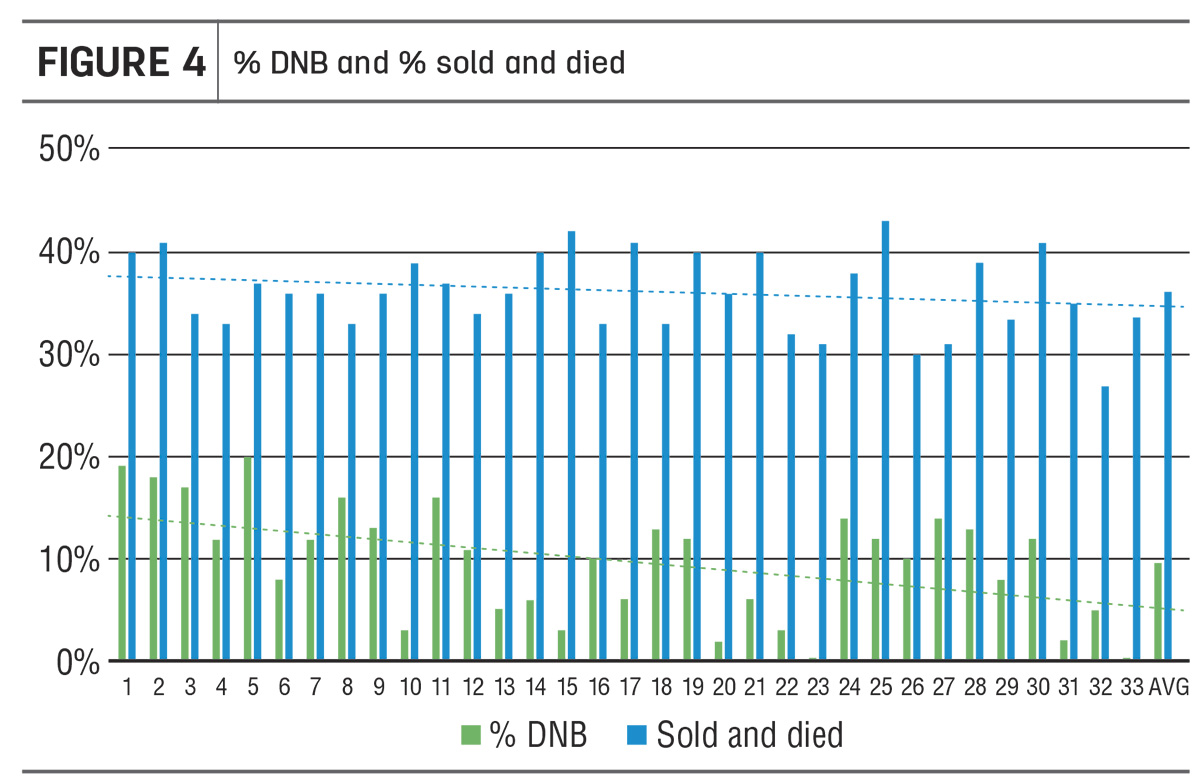
Lastly, let’s explore how ‘do not breed’ protocols affect pregnancy metrics. Looking at Figure 4: % DNB & % Sold & Died, there appears to be some correlation with more aggressive DNB protocols improving the % pregnant by 150 DIM, but again, it is not the main driver. You can’t DNB your way to high reproductive success…you need pregnant cows. Another point to note is that DNBs are not all the same in the impact they have on your pregnancy metrics. If you call DNB cows right from the start of their lactation, it will have more impact on bumping up your % pregnant by 150 DIM because you removed her from the pool. However, it will have a very minimal impact if you decide to mark DNB cows after 3 unsuccessful services, for example.
It’s important to note that there are several ways that % Pregnant by 150 DIM are calculated, that differ in the way they handle DNB cows. I prefer to include DNB cows in the calculation, using GRAPH DOPN FOR RC<7\ST, while the other common command (PCT DOPN<151 for LACT>0 DCAT>0) will exclude DNBs, thus yielding a higher number.
There’s No Silver KPI Bullet!
Every cow open past 150 days in milk represents lost revenue. Whether it’s fewer calves, lower peak milk, or poor feed conversions with extended lactations, reproductive inefficiency hits where it hurts most: your bottom line. Hopefully this deep dive on some of our most basic reproductive metrics has been helpful in fine tuning your view of your most important reproductive metrics. In a nutshell, there’s not one of these metrics that can do it all…the clearest view of your progress will be achieved by monitoring all three of these KPIs.
- % Pregnant by 150 DIM – The primary metric for reproductive success. Monitor to make sure that a high percentage of your herd is pregnant in a timely manner. This metric works well to compare across herds since it is not influenced by VWP and fully accounts for abortion losses.
- Pregnancy Rate – Still the best metric for monitoring your success every 21-days…timely feedback on your own herd’s reproductive trends. But be sure this is not your only metric, and it can be misleading without accounting for abort impacts, as well as the influence of your chosen voluntary wait period.
- Early Embryo Loss/Abort Rate – the often-overlooked metric that can have dramatic impacts on your reproductive financials. A great preg rate is not a great preg rate if aborts are high! Dig deeper…don’t accept high aborts as normal…it is a problem you can solve with the help of your dairy advisors.


